
Appearance
Load testing
Every suite has a Load tab. Same steps, run under concurrency. No second tool, no exporting to something else, no writing a k6 script to find out whether it holds up.
The two models
They answer different questions, and the difference matters enough that the panel says which one is active.
Closed model — concurrent users. N virtual users, each running the whole suite in order, each waiting for its response before sending again. Throughput is an outcome, not a target. This is the one that answers "how much can it hold".
Open model — fixed rate. Requests go out on a schedule whether or not earlier ones came back. This answers "can it sustain 500 a minute", which is a different question. Anything that cannot be dispatched on time is reported as a shortfall rather than quietly absorbed — the shortfall is the finding.
The schedule is computed from the run's start rather than by adding an interval to "now". Both setInterval and now-plus-delay accumulate drift, and over a few thousand requests that quietly turns 500/min into 480/min — indistinguishable from the server being slow.
Where it will send
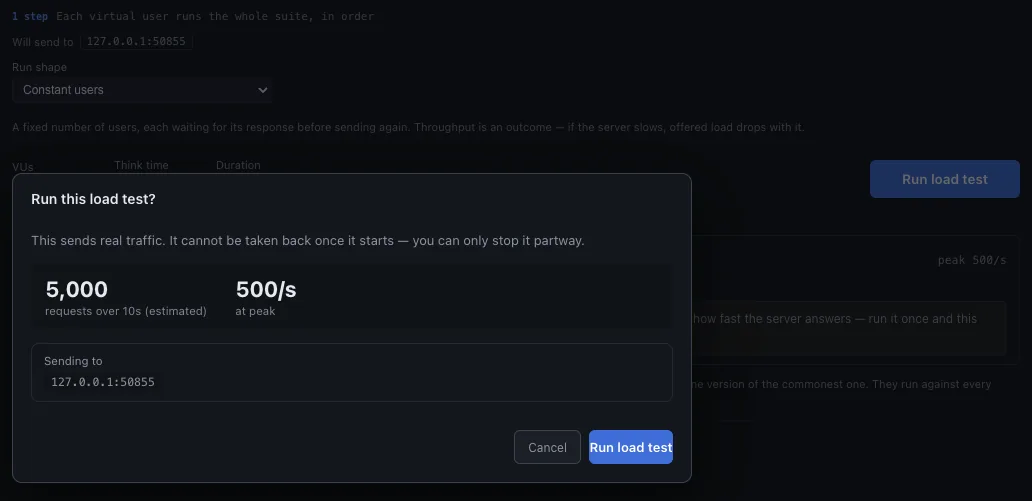
The hosts about to be hit are spelled out above the controls, and an external one is marked.
A load run sends thousands of requests, and a suite step is a reference to a request edited somewhere else — so the target is easy to be wrong about, and firing ten thousand requests at somebody else's API by accident should be impossible to do quietly.
If you want something safe to point a run at, the test services are there for it.
Checks
A run with no checks knows only whether a response arrived, not whether it was right. A service under load will happily answer 200 with an error page, and a run counting only status codes calls that a pass.
Checks run against every response and are counted rather than fatal:
| Status is one of | 200, 201, … |
| JSON field exists | by path |
| JSON field equals | by path and value |
| Body contains / does not contain | substring |
| Body is at least | bytes |
Failures are counted, and a bounded number of examples is kept so you can see what actually came back without storing thousands of bodies.
Results
Latency as percentiles — p50, p75, p90, p95, p99 and max. Nearest-rank, never interpolated: an interpolated p99 is a latency nobody experienced.
Status codes, by count.
Where the time went — DNS, TCP, TLS, time-to-first-byte and download across the whole run. This is what turns "it got slow" into "the handshake got slow".
Over time, so a service that degrades under sustained load looks different from one that is simply slow.
Thresholds
Set a bar for error rate and latency and the run passes or fails against it — the same idea as k6's thresholds, so a load test can gate a build rather than producing a number somebody has to interpret.
How much can it drive
Measured at roughly 23,000 requests a second on one laptop, flat from 10 to 400 concurrent. A second machine buys you nothing until you exceed that, which is why there is no distributed mode — and if you genuinely need more than that, the honest answer is k6.