Appearance
Reading the exchange
This is the tab the rest of the application is built around. When a request misbehaves, the body is usually the last place the answer is.
The Timeline
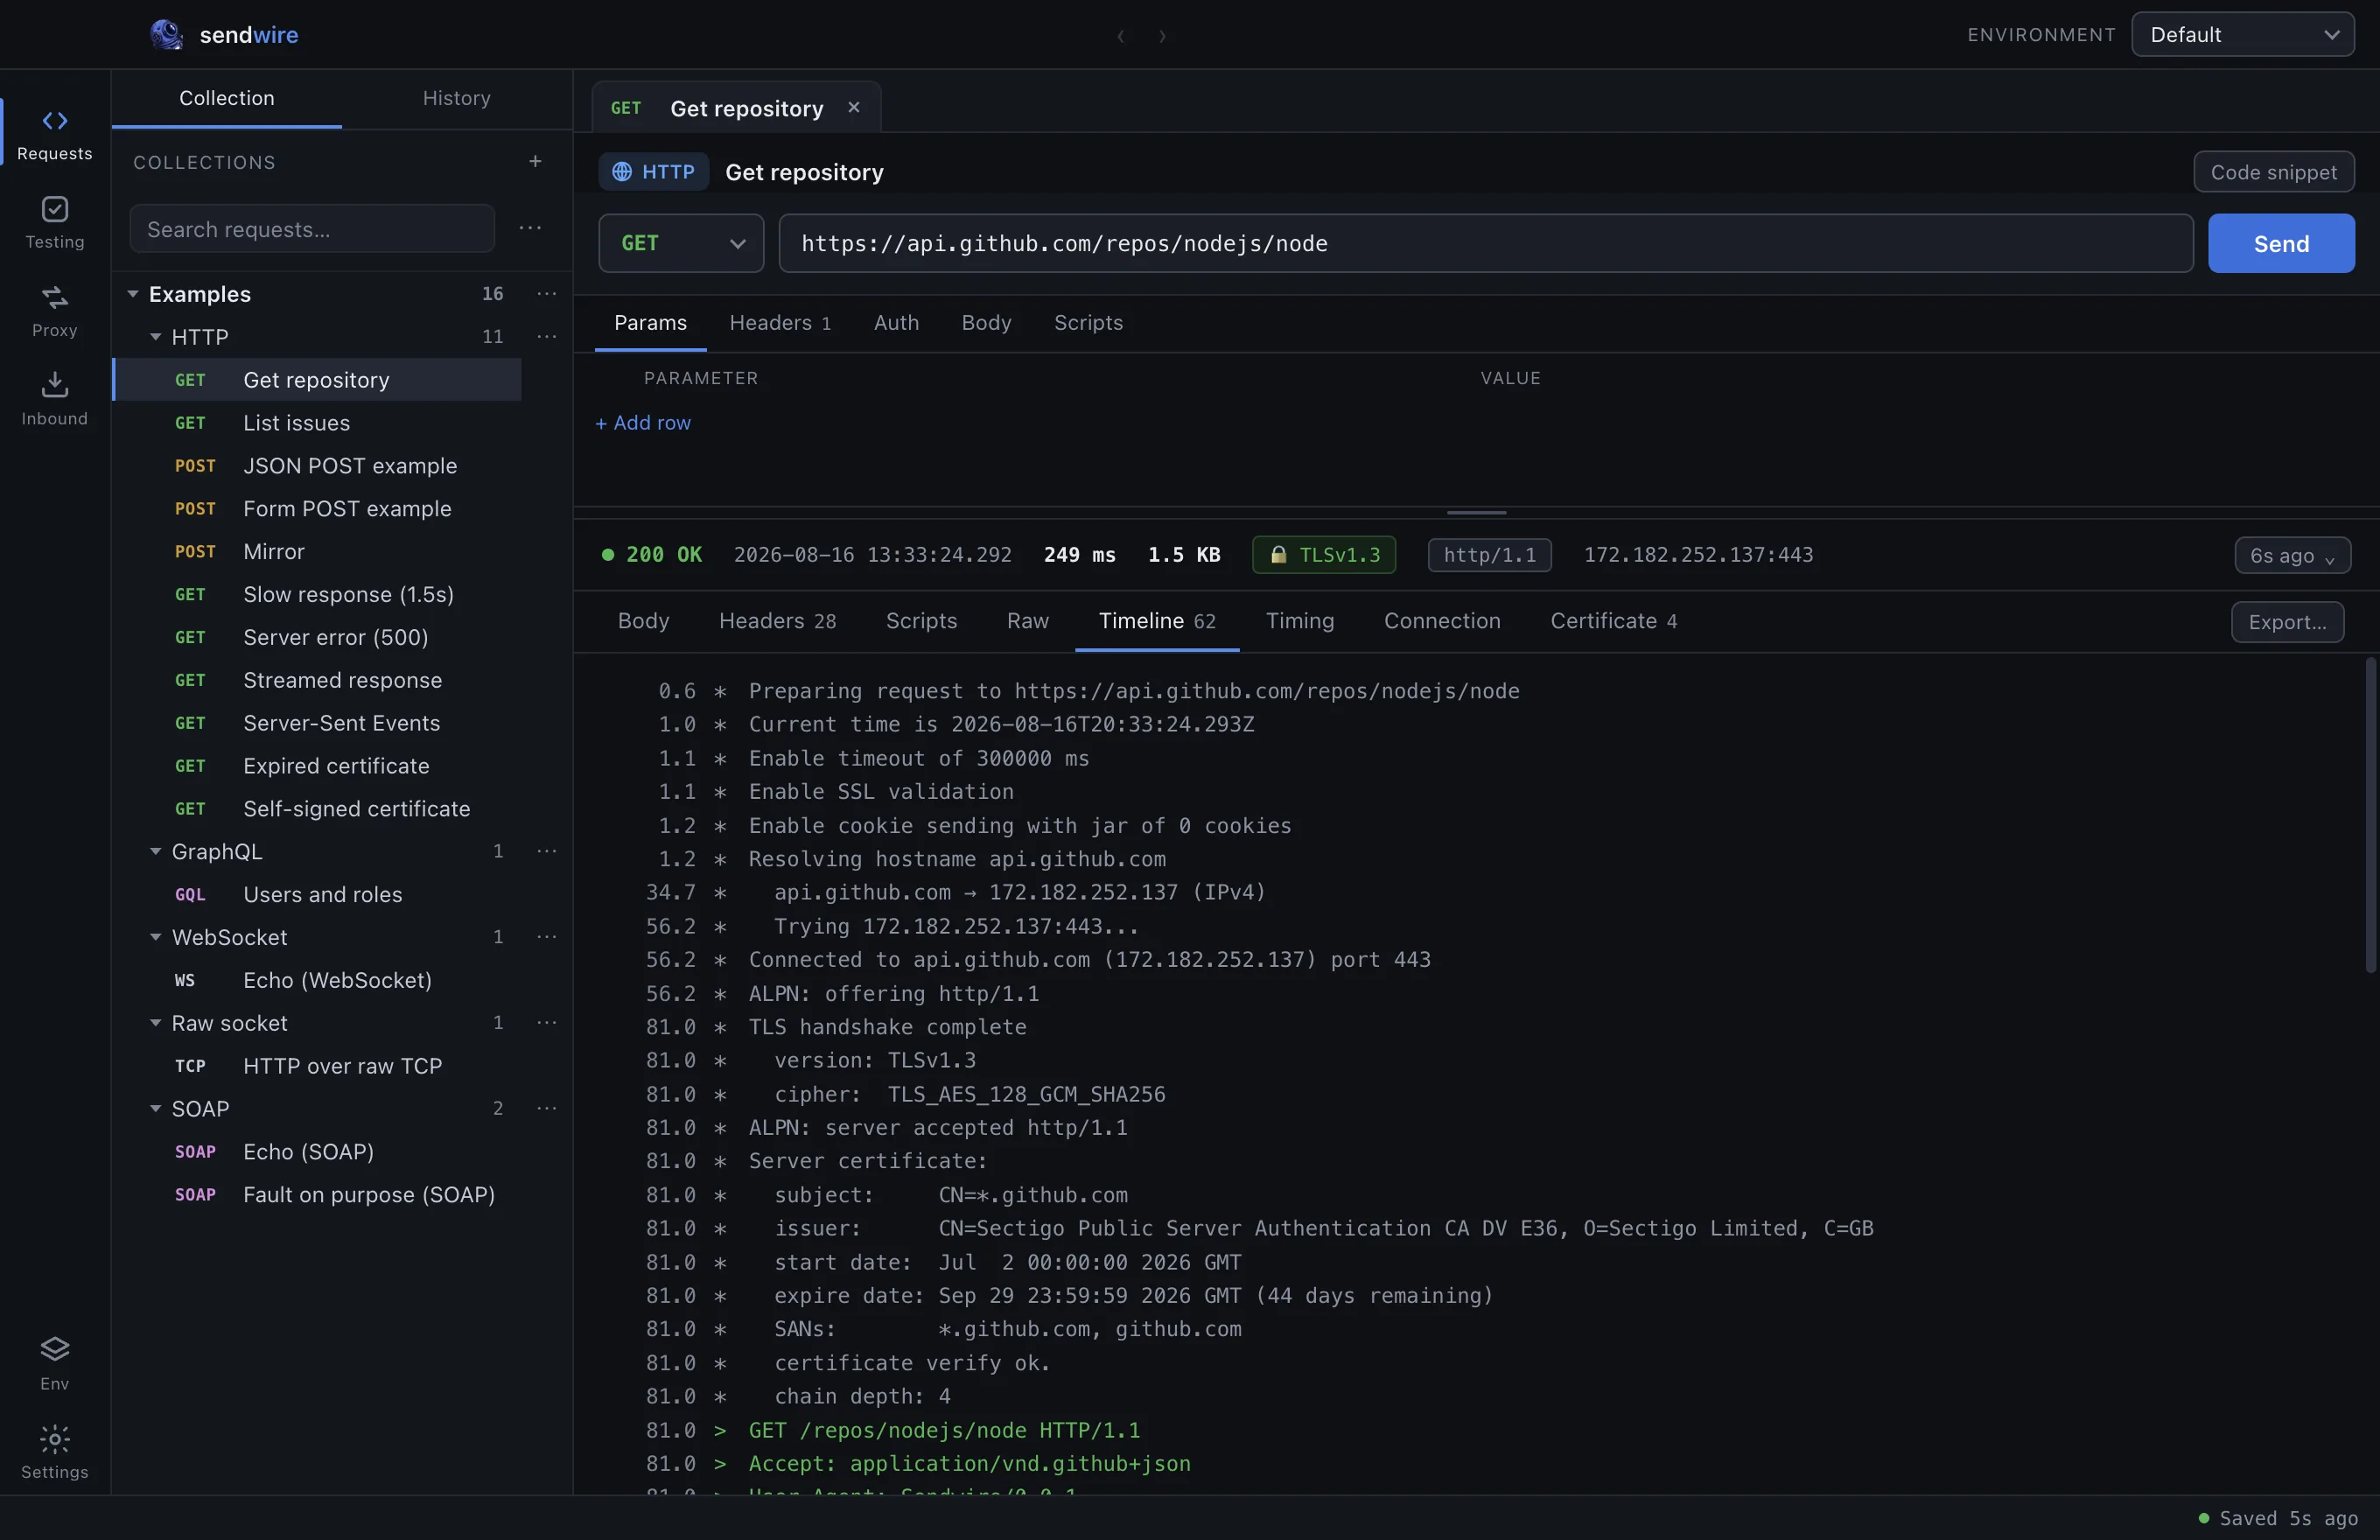
Every event, timestamped from the moment the request began:
    0.3  * Resolving hostname api.github.com
   26.5  *   api.github.com → 140.82.116.5 (IPv4)
   67.2  * Connected to api.github.com (140.82.116.5) port 443
   67.2  * ALPN: offering http/1.1
  116.8  * TLS handshake complete
  116.8  *   version: TLSv1.3
  116.8  *   cipher:  TLS_AES_128_GCM_SHA256
  116.8  * Server certificate:
  116.8  *   subject:     CN=*.github.com
  116.8  *   issuer:      CN=Sectigo Public Server Authentication CA DV E36
  116.8  *   expire date: Sep 29 23:59:59 2026 GMT (59 days remaining)
  116.8  *   certificate verify ok.
  116.8  *   chain depth: 4
  116.8  > GET /repos/nodejs/node HTTP/1.1
  116.8  > Host: api.github.com
  334.1  < HTTP/1.1 200 OK
The numbers on the left are milliseconds from zero. The gaps between them are the answer to most performance questions.
In the example above, 26 ms went to DNS, 41 ms to the TCP connect, 50 ms to the TLS handshake — and 217 ms waiting for the server to say anything. That last number is the only one the server controls.
What each mark means
* | Something the client did or observed. |
> | Bytes sent. |
< | Bytes received. |
! | An error. |
Timing
The same information as a waterfall, split into DNS, TCP, TLS, time-to-first-byte and download.
Use it to answer "why is this slow" without guessing. A slow handshake and a slow server look identical from the outside and have nothing to do with each other.
Connection
Which IP answered, which port, whether the connection was reused, and which ALPN protocol was agreed.
Connection reuse matters more than it looks. A benchmark that silently reconnects every time is measuring the handshake, not the endpoint — and nothing else will tell you that is what happened.
Certificate
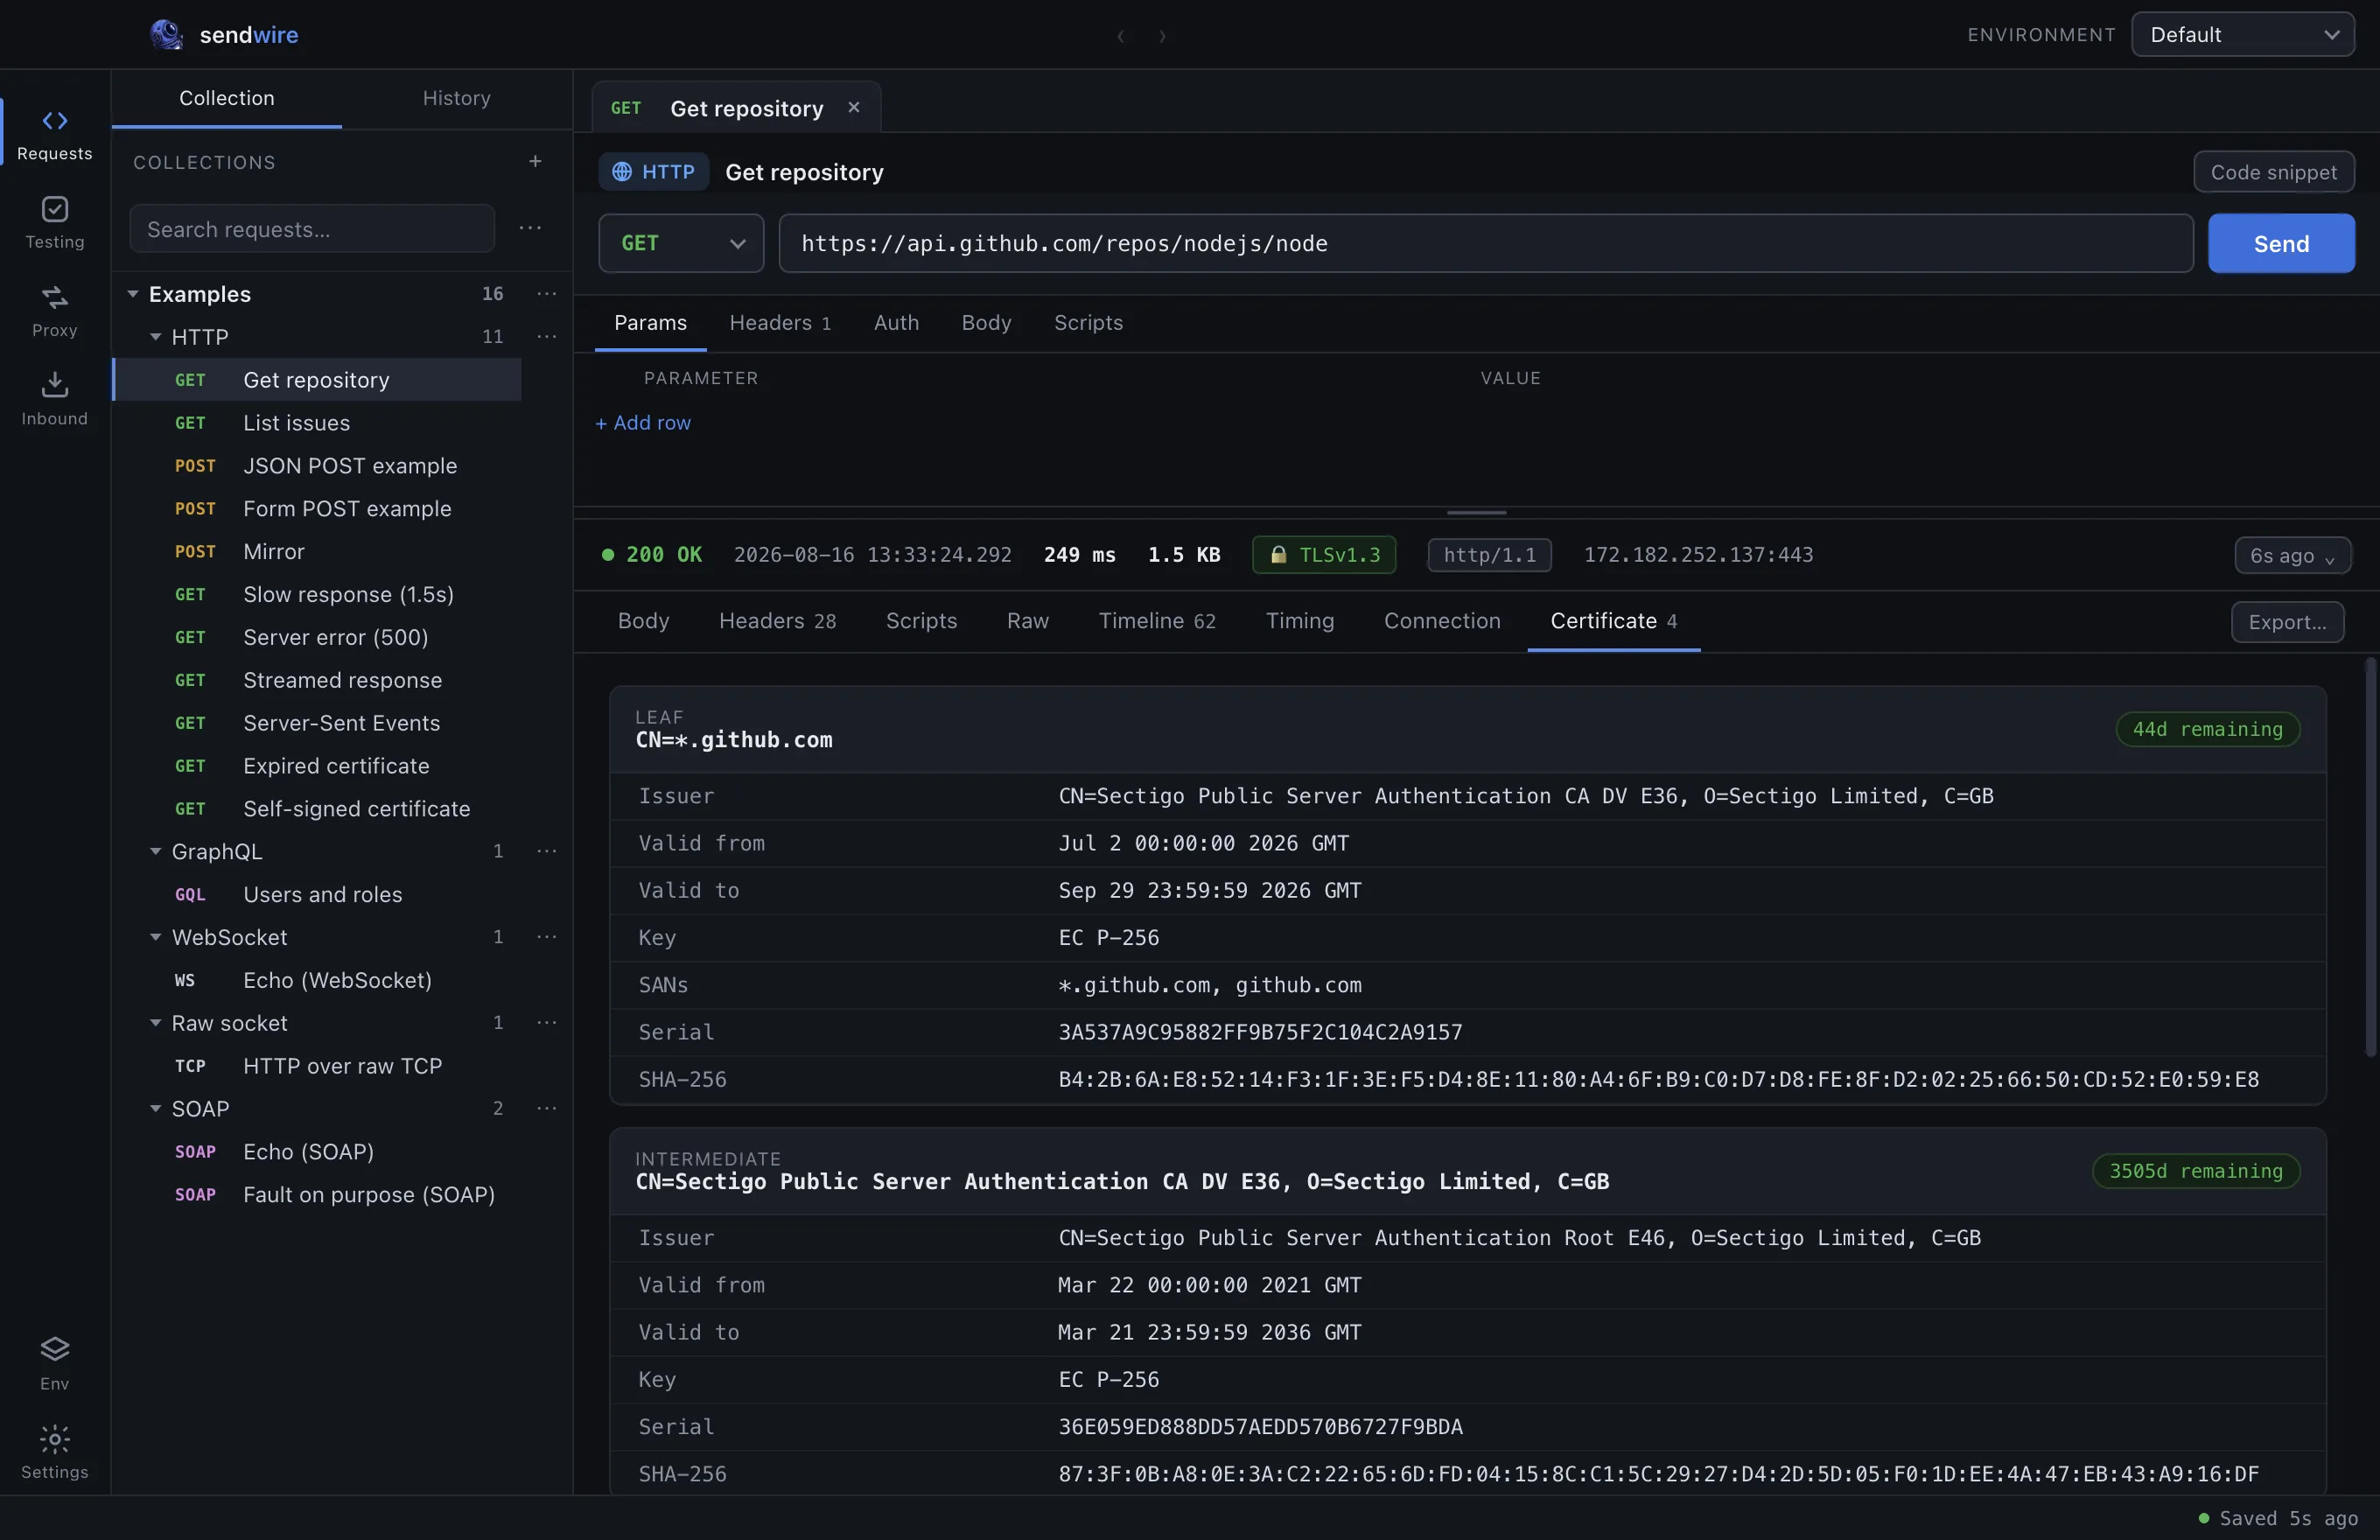
The full chain the server presented: subject, issuer, validity, SANs and chain depth for every hop.
Expiry is counted in days remaining, because that is the number you actually wanted.
Raw
The request and the response as text, headers and body together, in the order they went over the connection. Copy the whole exchange with Copy exchange.
Bodies are shown as received. Tick Pretty-print bodies to format them — untick it when you need to see exactly what arrived, which is the point of this tab.
Compressed bodies
A gzip, deflate or br response is shown decompressed by default, so you read the payload rather than the packed bytes. A Decompress toggle flips between the two when you want to confirm what was actually on the wire.
Streaming
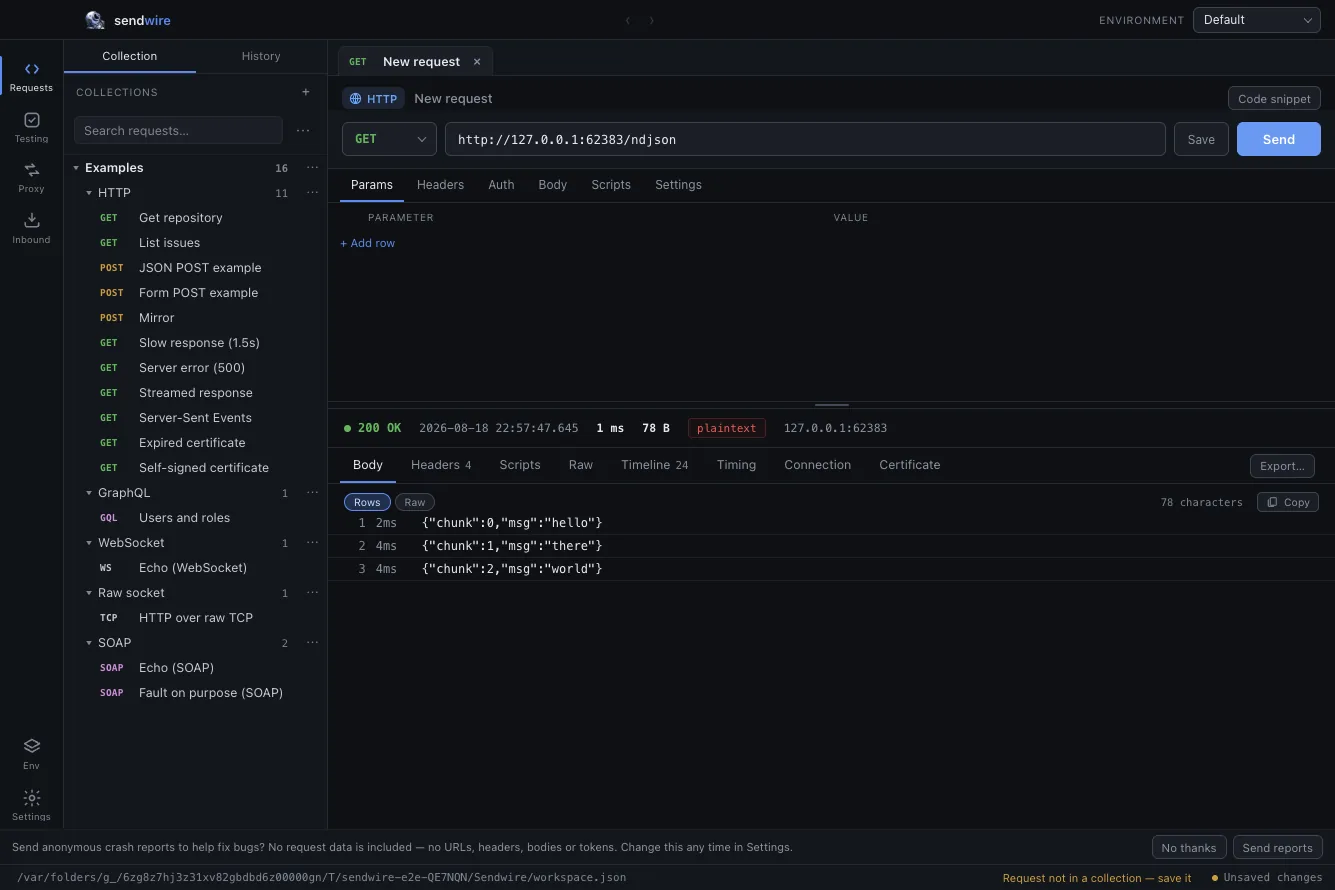
A response that arrives over time — a text/event-stream (Server-Sent Events) feed, or newline-delimited JSON — is not made to wait for its end. It fills in live, one record at a time, and each row carries the moment its chunk arrived, so a stream that stalls halfway shows exactly where.
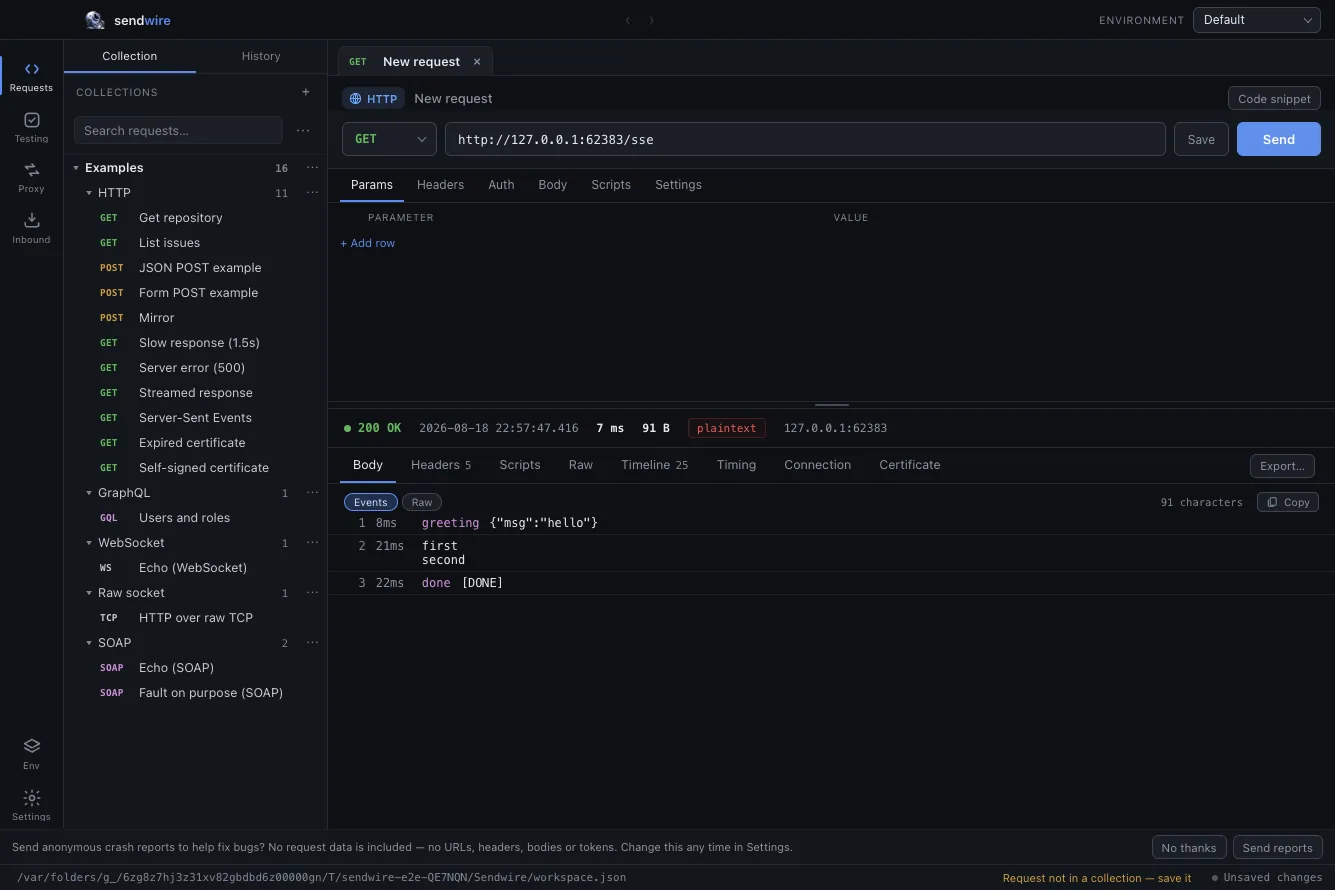
Server-Sent Events become an event list (event name, id, and data); NDJSON becomes one row per line. Cancel a stream and the rows that already arrived stay on screen — a partial read is still a read.